The Number That Gets Announced and the Number That Matters
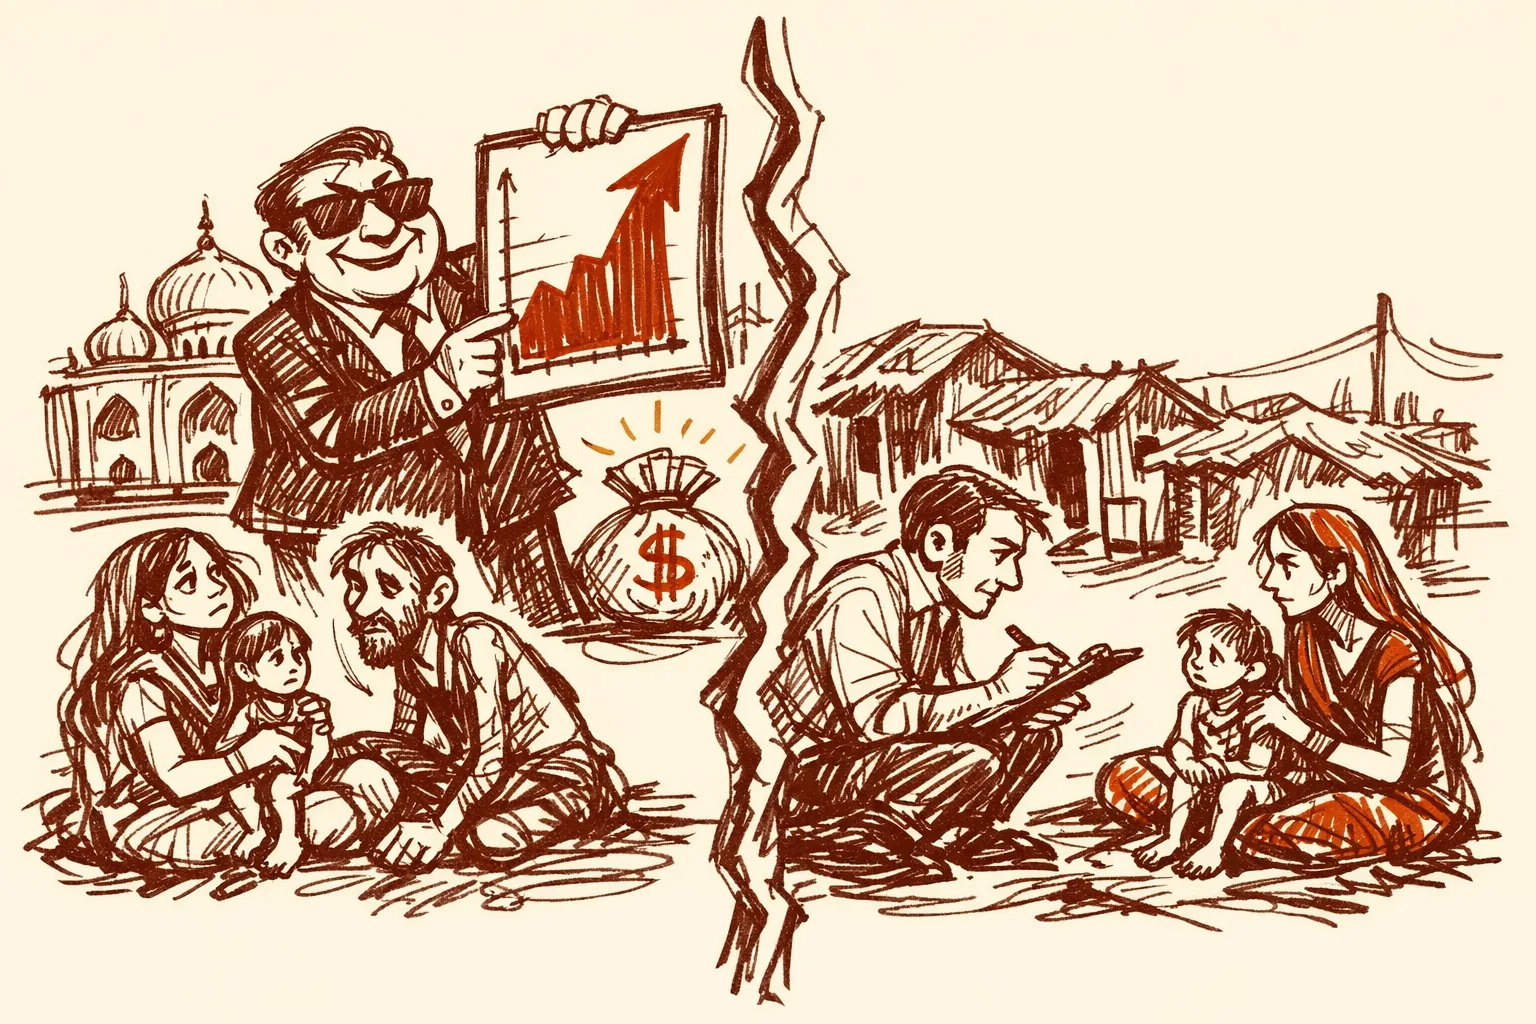
India has made real progress on poverty. That is not in dispute. The number India announces to the world - roughly 5% extreme poverty - reflects genuine gains. But it answers only part of the question. It measures survival, not living standards. And it is built on a poverty line that no government has updated in over fifteen years.
To keep accelerating, India needs honest data. The official story and the ground reality still have a gap worth closing.
The Scale of the Remaining Challenge
The World Bank sets three different poverty lines for different types of countries. The first is the extreme poverty line, now set at $3 per day. By this measure, India's poverty rate is 5.3% - about 75 million people.
That is real progress. Here is the fuller picture.
India is a lower-middle-income country. The World Bank says the right poverty line for countries at India's development level is $4.20 per day. At that line, nearly one in four Indians is poor. That is about 342 million people.
In plain terms: India has beaten bare-survival poverty. The next frontier is beating poverty by the standard appropriate for its own rising income level.
From the survey period covering 2011-12 to 2022-23, the share of people living below the $4.20 per person per day line dropped from 57.7% to 23.9%. That is major progress. In 2022-23, 46% of India's remaining poor lived in just three states: Uttar Pradesh, Bihar, and Maharashtra.
The Hunger Challenge That Remains
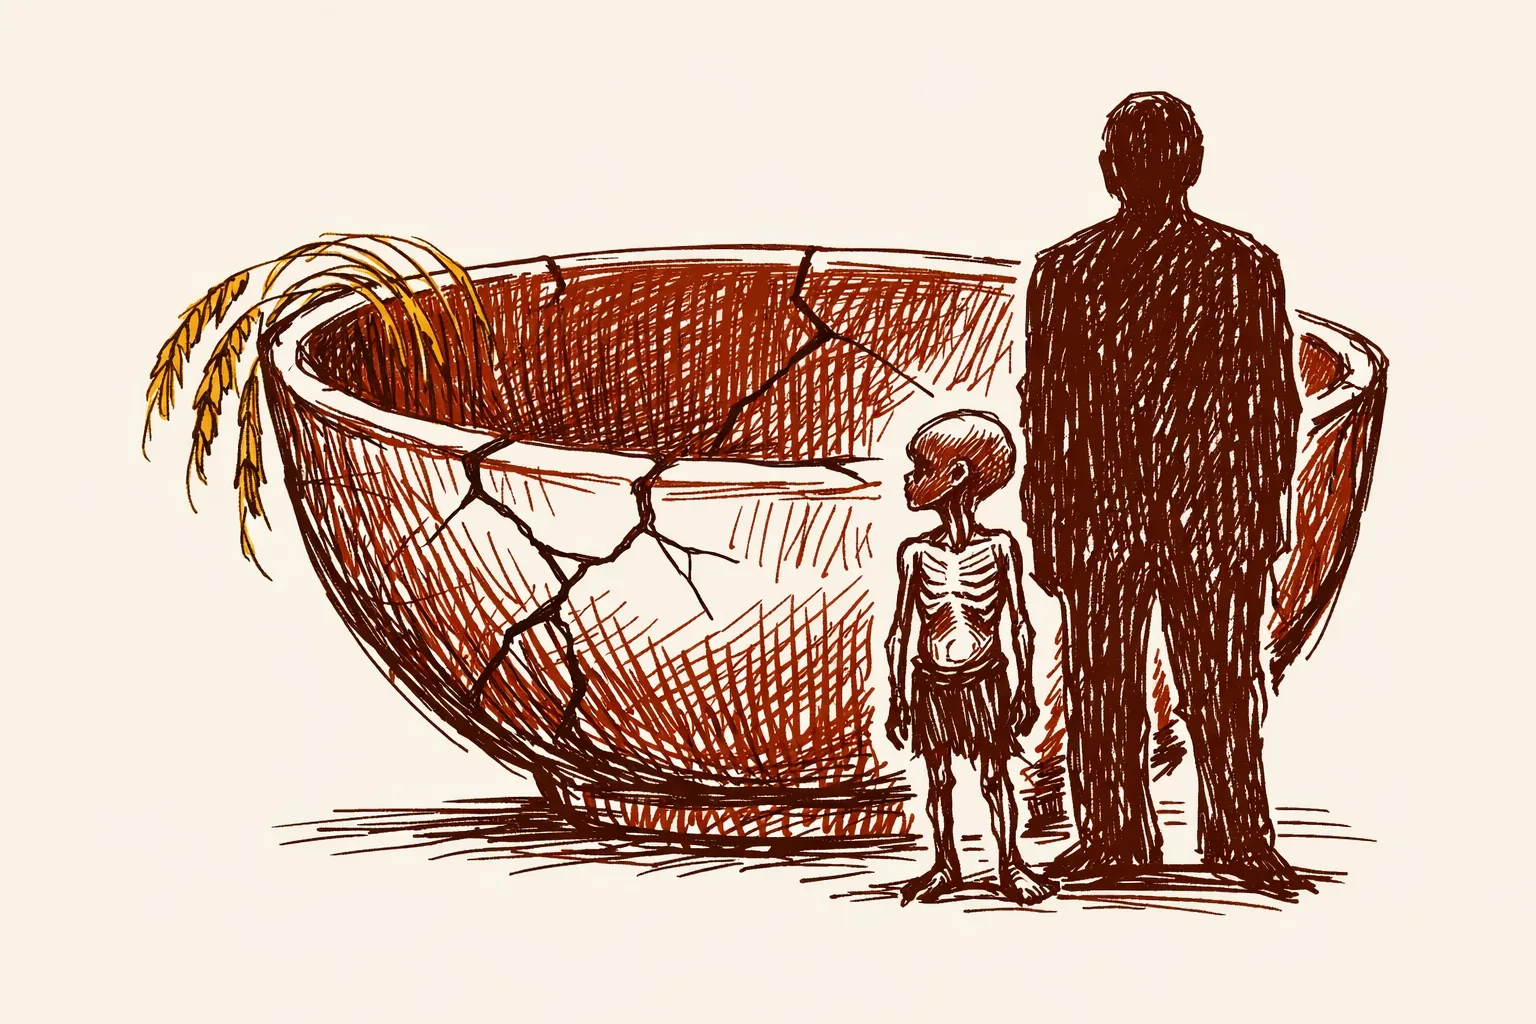
India ranks 102nd out of 123 countries in the Global Hunger Index. India's child wasting rate, at 18.7%, is the second highest in the entire report.
Child wasting means a child is too thin for their height. It signals acute malnutrition. India still faces a child stunting rate of 32.9% and an undernourishment rate of 12%. One in three children under five is stunted - meaning too short for their age, indicating chronic malnutrition.
A stunted child becomes a less productive adult. The World Bank estimates that malnutrition costs developing economies between 2% and 3% of GDP annually. Solving this is not just a welfare issue - it is an economic priority.
Why the Official Numbers Need Updating
India's official poverty line has not been updated since the Tendulkar Committee set it in 2009. The last official estimates of poverty pertain to 2011-12, putting all-India poverty incidence at 21.9%.
The Indian government commissioned a new poverty line from the Rangarajan Committee in 2014. That committee recommended a higher, more realistic line. Neither the Congress-led UPA government that commissioned the report nor subsequent administrations have formally adopted it.
Former Chief Statistician Pronab Sen has criticised the continued use of outdated norms, calling it a blow to the credibility of such assessments.
Without an updated official poverty line, there is no updated official poverty count. India cannot fully measure the impact of its own successful programs without better measurement tools.
The government points - with good reason - to its Multidimensional Poverty Index, which measures deprivation across health, education, and living standards. This data shows genuine improvement. But it works best alongside an updated income poverty line, not as a substitute for one.
The survey data itself requires care. Changes in questionnaire design, survey implementation, and sampling in the 2022-23 survey present challenges for making comparisons over time. Multiple independent economists - including Santosh Mehrotra at the University of Bath and S. Subramanian - have noted the new survey methodology makes direct comparisons with older data unreliable.
Two Indias - and the Governance Gap Between Them
State-level data shows why a single national poverty number only tells part of the story. Multidimensional poverty is below 1% in Kerala and as high as 35% in Bihar.
Kerala has invested heavily in education and public health for decades. The result is poverty rates comparable to middle-income European nations. Bihar and other lagging states show that local governance quality is the key variable - not national economic trends alone.
72% of India's poor are concentrated in ten lagging states. The national average improving is genuinely good news. But the remaining concentration of poverty reflects specific state-level governance gaps that need targeted solutions.
What Has Already Been Built
India has not ignored its poverty challenge. The Modi government has spent massively and built real infrastructure for delivery. The question now is optimizing that delivery.
MGNREGA (the rural jobs scheme, active since 2006) promises 100 days of paid work per year to any rural household that wants it. With over 25 crore registered workers, the budget this year is Rs 86,000 crore - roughly $10 billion.
Delivery needs to improve. Only about 7% of households got the full 100 days in the most recent full year. Workers are supposed to be paid within 15 days. As of February this year, unpaid wage liabilities stood at Rs 12,219 crore - more than a quarter of the scheme's budget. Limited fund flow means the scheme can only offer households 45 to 55 days of work - half the promised amount.
Wages are another gap. Workers in many states earn around Rs 200 per day, well below market labour rates. A parliamentary committee recommended raising wages to at least Rs 400 per day. Acting on this recommendation would make the scheme far more effective.
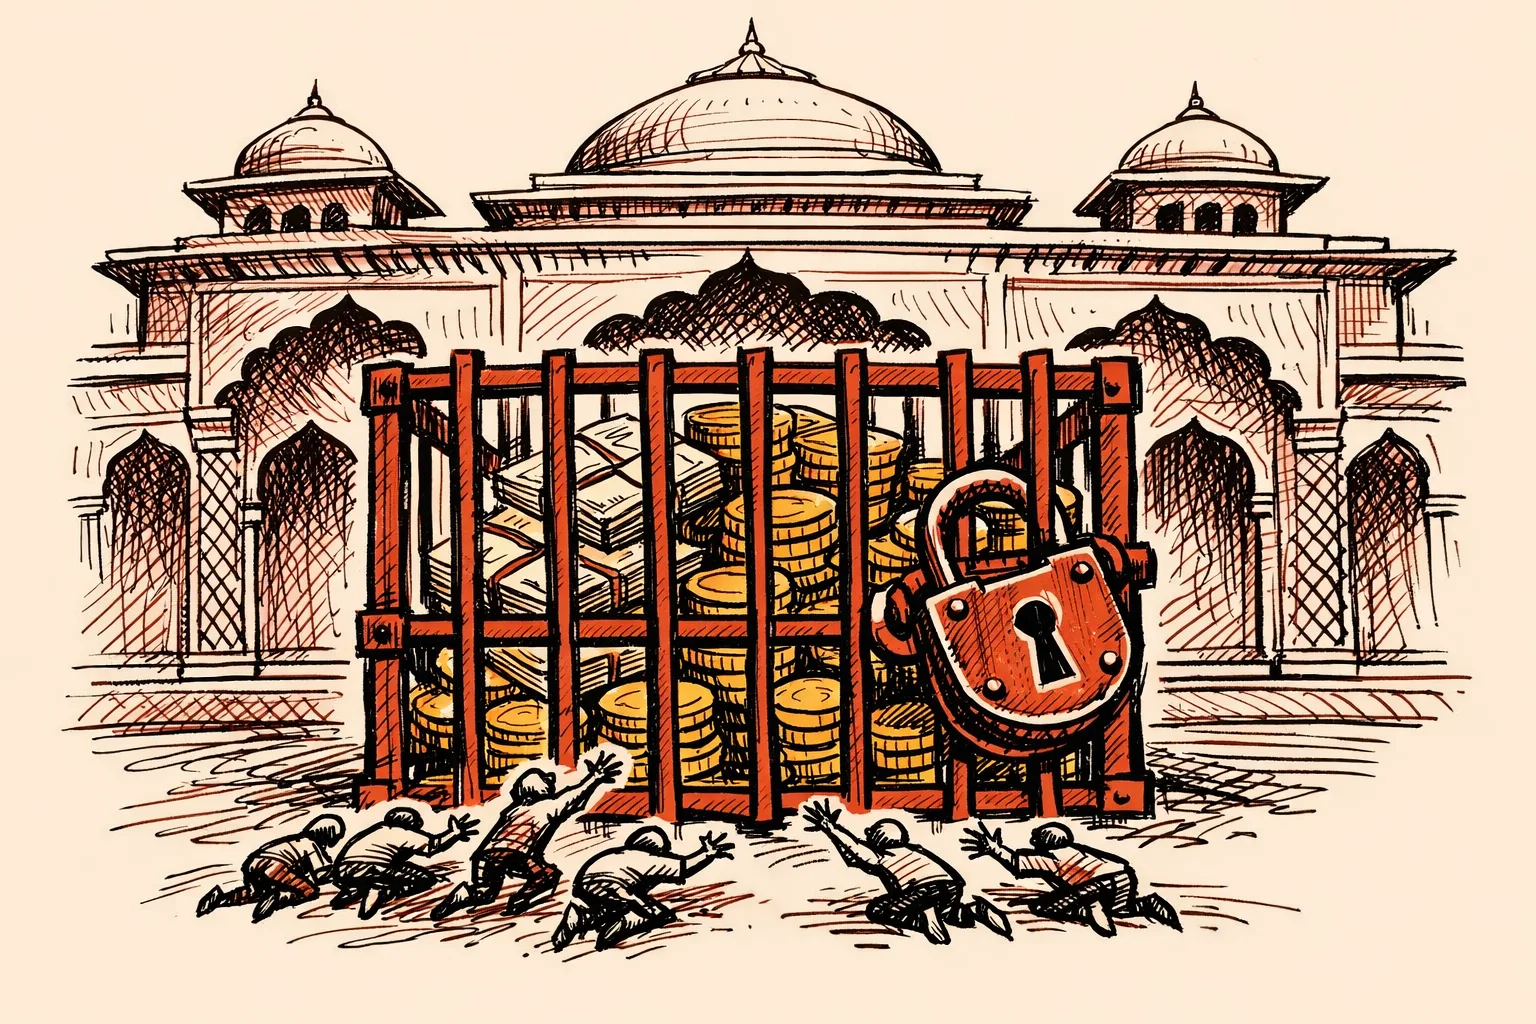
Direct Benefit Transfers and free food have been among the Modi government's most effective tools. India has opened over 537 million bank accounts through the Jan Dhan drive. The PM-GKAY scheme provides subsidized rations to 800 million people. These transfers genuinely reduced destitution during the COVID shock and represent a landmark achievement in direct delivery.
The next step is pairing these transfers with income-generating opportunities. Free food reduces visible hunger without creating income. Including the market value of free rations in household consumption surveys makes recorded consumption rise - which is worth tracking separately from income growth.
How Other Countries Accelerated Out of Poverty
Vietnam is the most instructive comparison. In 1986, Vietnam launched Doi Moi reforms, dismantling its planned economy, opening to international markets, and initiating pro-business reforms. The country was then among the poorest in Asia.
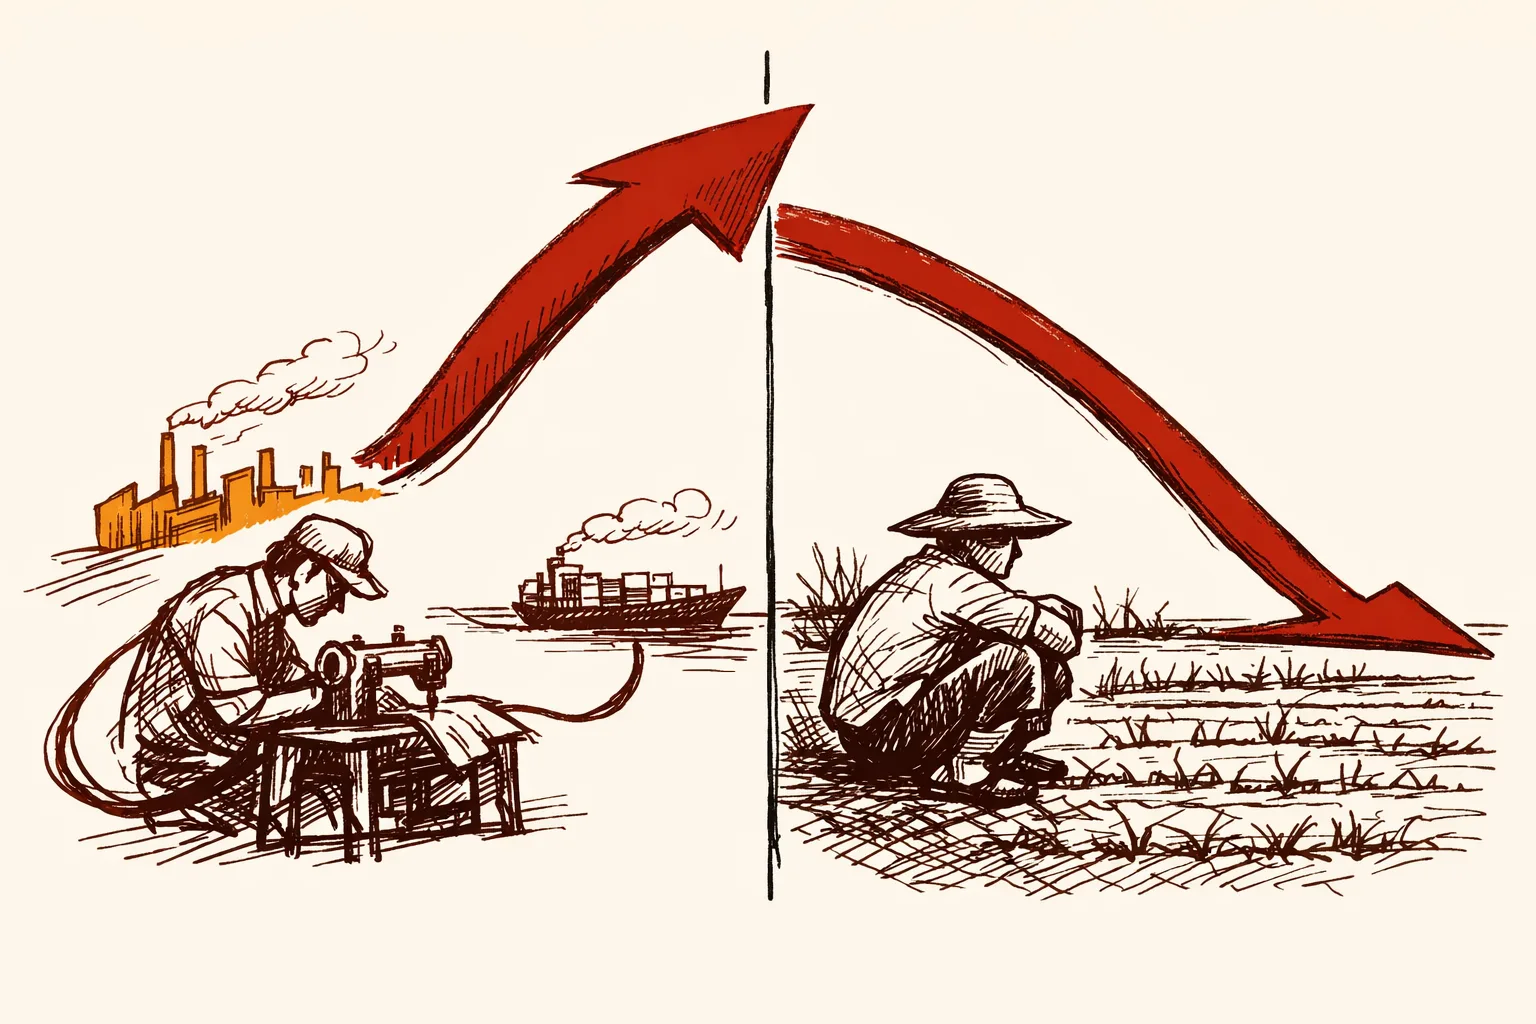
The first step was agricultural. Cooperative farms were dissolved and households given rights to land. Food production soared. The second step was manufacturing jobs. Trade liberalization, deepening after 2000, integrated Vietnam into global supply chains. Exports of manufactured goods grew at 20% per annum from 2000 to 2019, creating millions of steady jobs.
The result: from 60% of the population in poverty in 1990, extreme poverty reached 2% by the early 2020s.
India has grown fast. But nearly half a billion working-age Indians remain unemployed or inactive. Vietnam's poverty fell because it created formal jobs in manufacturing that absorbed the rural poor into the cash economy. India's growth has been strong in services. Replicating that manufacturing absorption effect - especially in the poorest states - is the next major lever.
Where Accountability Belongs
The Ministry of Rural Development controls MGNREGA, the rural housing scheme, and India's main rural poverty programs. The Rs 86,000 crore MGNREGA budget has remained flat for five consecutive years in nominal terms - a real-terms cut each year given inflation. This needs to change.
The Ministry of Statistics and Programme Implementation controls the household consumption surveys that form the basis for all poverty estimates. The controversy over the 2017-18 consumption survey - which was delayed for years before release - created unnecessary uncertainty. Timely, transparent data publication should be a non-negotiable standard going forward.
NITI Aayog publishes the Multidimensional Poverty Index, which has shown genuine progress. The next step is pairing that with an updated income poverty line so India can track both dimensions together.
Parliament has asked at least seven separate questions across both houses about when India will update its official poverty line. A clear timeline from the government would strengthen trust in India's development story - not weaken it.
What Would It Cost
Fixing India's poverty measurement system - establishing a new poverty line committee and publishing updated estimates - costs essentially nothing. It requires a policy decision, not a budget allocation.
Raising MGNREGA wages from roughly Rs 200-300 per day to Rs 400 per day would require approximately Rs 30,000-40,000 crore in additional annual allocation. That is less than 0.15% of India's GDP.
The bigger cost is delay. With India's child wasting rate at nearly 19%, productivity loss compounds across the entire labor force for decades. Economists at the Asian Development Bank have estimated that South Asia's child undernutrition costs the region roughly 3% of GDP annually.
India can afford to fund its anti-poverty programs at a higher level. The question is whether delivery systems are running with enough efficiency and integrity to make every rupee count.
What Needs to Happen Next
India needs to do three things to accelerate further.
First, update the poverty line. The government should appoint a new expert committee - with a fixed six-month mandate - to set an income poverty line appropriate for India's current development level. Better measurement strengthens the case for India's progress, not weakens it.
Second, fix MGNREGA delivery. Raise wages to at least Rs 400 per day - the level the government's own expert committee recommended - and clear the Rs 12,219 crore in unpaid wages immediately. Economist Jean Dreze has noted that raising wage rates would benefit all workers, while increasing guaranteed days would benefit only a small minority.
Third, shift from transfers to jobs. Free food reduces visible destitution. It does not create the non-farm rural jobs that allow families to permanently exit poverty. India should scale investment in rural manufacturing and agri-processing clusters in its poorest states - particularly Bihar, Jharkhand, Uttar Pradesh, and Madhya Pradesh - to absorb unskilled labor into formal wage employment. This is exactly the model that complements the infrastructure investment the Modi government has already made in these states.
Kerala solved its poverty problem by investing in human capital for generations. Vietnam solved its by giving farmers land rights and connecting them to global supply chains. Both models have evidence behind them. India has the platform to do both at scale.